 . Unfortunatly this has changed for the worse, in that as of Mapnik
3.x, the Python bindings are not documented any more. In addition, they have
been
moved
out of the Mapnik repository to a
separate one.
. Unfortunatly this has changed for the worse, in that as of Mapnik
3.x, the Python bindings are not documented any more. In addition, they have
been
moved
out of the Mapnik repository to a
separate one.
| ↑ Online manuals | ↑↑ OpenStreetmap Hacker's guide |
Mapnik is a very complex and powerful library for rendering maps that comes almost entirely without documentation. A wiki exists, but as for OpenStreetmap itself, it is impossible to know which information is current and which is outdated. So users of Mapnik should be aware that they may need to go down to the source code to obtain information they need. The rude title is designed to remind you of that.
Mapnik is written in C++ but also has Python bindings. The Python functions
are a bit more high-level, saving you some hassle. The Python API also used to
be the only one that was
documented. Unfortunatly this has changed for the worse, in that as of Mapnik
3.x, the Python bindings are not documented any more. In addition, they have
been
moved
out of the Mapnik repository to a
separate one.
Considering that Mapnik does not even try to provide up-to-date docs, one should not expect the Python bindings to be kept up to date. Splitting a repository opens the way to different update schedules. It also opens the way to extra trouble when having to build an additional project. For that reason I cannot recommend using the Python API any more, and this page will exclusively deal with C++.
Unlike other software packages, Mapnik does not have knowledge of its own auxiliary directories built-in or in configuration files. Rather, every program using it has to tell it the paths to its data source plugins and its fonts, with the following method calls:
#include <mapnik/datasource_cache.hpp>
#include <mapnik/font_engine_freetype.hpp>
...
mapnik::datasource_cache::instance().register_datasources("/usr/lib/mapnik/input/");
mapnik::freetype_engine::register_fonts("/usr/lib/mapnik/fonts");
The Map class also has a register_fonts() method that can be used to set the font directory after creating the map object. Both register_datasources() and register_fonts() have a second argument of bool type that activates recursion through subdirectories.
Unless you want to render a world map, you have to tell Mapnik which region to render. This is done by constructing a box2d object. As you will normally know the boundaries of the region in latitude and longitude rather than the coordinates of your map projection, you also have to project those latitude/longitude values to your map's projection with a projection object. The following example assumes your map uses the pseudo-mercator projection that is the default for OpenStreetmap PostGIS databases.
#include <mapnik/projection.hpp>
#include <mapnik/box2d.hpp>
...
proj= new mapnik::projection("+init=epsg:3857");
startx= longitude1;
starty= latitude1;
endx= longitude2;
endy= latitude2;
proj->forward(startx, starty);    // call by reference modifies startx/y
proj->forward(endx, endy);        // call by reference modifies endx/y
box= new mapnik::box2d<double>(startx, starty, endx, endy);
Rendering a map takes three objects: a map object, a renderer object and an image object as a target for the rendering result. Using the box2d object from above to set the map region, rendering and saving a map works like this:
#include <mapnik/map.hpp>
#include <mapnik/load_map.hpp>
#include <mapnik/agg_renderer.hpp>
#include <mapnik/image.hpp>
#include <mapnik/image_util.hpp>
...
map= new mapnik::Map(image_width, image_height, "+init=epsg:3857");
mapnik::load_map(*map, "osm.xml");
map->zoom_to_box(*box);
mapimage= new mapnik::image_rgba8(image_width, image_height);
renderer= new mapnik::agg_renderer<mapnik::image_rgba8>(*map, *mapimage);
renderer->apply();
mapnik::save_to_file(*mapimage, "osm.png");
Presumably the projection in the third argument of the Map constructor has to be the same as in the map style file and in the code calculating the map region. save_to_file() accepts an image type string as a third argument, which can be "png", "jpeg", "tif" or "webp". Otherwise the type is inferred from the image file name.
My simple rendering program renderosm.cpp is here. The code snippets above were taken from it.
Another example of a simple rendering program is mapnik-render that comes
with the Mapnik library. The source is on the web
here.
Structure -- Data sources -- Symbolizers -- Fonts -- Map scale -- Projections -- XML entities
Mapnik style files are XML files containing tags describing map features.
There is documentation for some of the tags in the Mapnik wiki.
This page is a good
starting point. However one should be aware that wiki pages are not
necessarily up to date.
The general structure of an XML style file is the following:
<Map>
    <Style name="foobar">
        <Rule>
            <!-- ... -->
        </Rule>
        <!-- more rules... -->
    </Style>
    <Layer>
        <StyleName>foobar</StyleName>
        <Datasource>
            <!-- ... -->
        </Datasource>
    </Layer>
    <!-- more styles and layers... -->
</Map>
The map contains a set of layers and corresponding styles. The styles describe the appearance of map features, while the layers define the data sources and rendering order. Layers placed later in the style file draw over earlier layers. The position of Style tags in the file does not matter.
A Style tag contains one or several Rule tags that describe the appearance of a feature. Different rules in the same style usually contain qualifiers that make them mutually exclusive, such as map scale ranges or restrictions to different features.
The Datasource tag specifies how mapnik obtains the features it renders into a map. It typically has several <Parameter name="name">value</Parameter> child tags. The parameter with name "type" specifies the type of data source, and different datasources allow (and require) different additional parameters. The data source types most relevant for OpenStreetmap rendering are postgis and shape.
The most important parameter, the coordinate system (= spacial reference system = map projection) used in the data source, is not specified in the Datasource tag at all, but rather in the srs attribute of the Layer tag that uses the data source. That makes it possible in principle to keep quantities using different coordinate systems in the same data source.
Data source type postgis
This is the usual way to access data from OpenStreetmap after it has been entered into a PostgreSQL / PostGIS database using osm2pgsql. The following parameters are available:
| Name | Explanation |
|---|---|
| host | Host running database server, 127.0.0.1 if on the same machine |
| port | Port number of database server (PostgreSQL default: 5432) |
| dbname | Database name (usually gis in standard OpenStreetmap setups; chosen when creating the database) |
| user | Database user name (usually mapper in standard OpenStreetmap setups; chosen when creating the database) |
| password | Database user password (usually not set) |
| table | Name of database table, or sub-query |
| estimate_extent | Set to true to avoid huge performance penalty |
The table parameter can be the name of a database table such as planet_osm_point in its simplest form. But that would fetch the complete table from the database and leave Mapnik to filter out the features to be rendered from the table. Database servers are much better at that kind of filtering, as it is one of their main jobs. Fortunately PostgreSQL supports the sub-query feature of the SQL database query language. Its basic syntax is (<query>) as foo, where <query> is an SQL query and foo is an arbitrary identifier. Such a sub-query can be used in a database query where otherwise the name of a table would be required, and if you put a sub-query into the table parameter, Mapnik will do just that. In the OpenStreetmap standard style, all table parameters are sub-queries.
To write SQL queries, you need to learn a bit of SQL. The general syntax of a sub-query is:
(select <columns> from <table> where <qualifiers>) as <identifier>
Simple examples suitable for Mapnik data sources are:
(select * from planet_osm_point where barrier = 'gate') as foo
(select * from planet_osm_line where historic in ('citywalls', 'castle_walls')) as foo
The above queries use * to select all columns of the database table. It is also possible to extract only some columns, reducing the data volume further. Mapnik itself needs only the way column. Other columns only have to be retained if the corresponding style rules have Filter child tags that need them (see below). Examples:
(select way from planet_osm_line where historic in ('citywalls', 'castle_walls')) as foo
(select way,aeroway from planet_osm_point where aeroway in ('airport','aerodrome','helipad')) as foo
More complicated examples can be found in the
standard OpenStreetmap
style, from which the above were also taken.
This page documents more
parameters for postgis data source, and
this page
describes optimisations through sub-queries and extents and gives examples of
database queries performed by Mapnik for different choices of parameters. For
more on SQL queries, read the
PostgreSQL
documentation.
Rule qualifiers for postgis data sources
The Filter tag is a child tag of Rule, i.e. a style rule. Even though apparently unrelated to the data source, it seems to be used exclusively to apply some additional filtering to database entries from a postgis source. A simple example:
<Filter>[aeroway] = 'helipad'</Filter>
This page has more examples and
some syntax documentation.
Map extent
Several parameters of the data source tag relate to different ways of obtaining the extent, which in this context seems to mean the maximum region for which a data source provides data. The parameters seem to apply only to data sources related to PostGIS, postsgis and pgraster.
The extent can be given explicitly in the extent parameter, which causes Mapnik to restrict queries to that region. This duplicates the information of which map region to render (I do not know who thought that up, or what they have been smoking). Its syntax is four floating-point coordinates separated by commas, interpreted as longitude 1, latitude 1, longitude 2, latitude 2 in the projected coordinate system (which is also the coordinate system of the database). Note that if you put that into a style file, you will not be able to use it for rendering regions outside the extent, even if the database covers them.
If the extent is not given explicitly, Mapnik tries to determine the maximum extent of the database contents using a PostGIS query. Why it does this is a mystery, as that maximum extent can place no additional restriction on data queried for rendering. The parameters estimate_extent and extent_from_subquery are designed to make this more efficient, by obtaining an estimate only or not operating on full tables, respectively. In my limited experimentation, estimate_extent worked almost as well as a hand-coded explicit extent. extent_from_subquery seems quite useless with styles like the one of OpenStreetmap, as its subqueries select by type of feature and do not reduce the geographical spread of query results.
This data source supports files in shapefile format. Such files are basically georeferenced vector data, just as raster files (GeoTIFF for example) are georeferenced pixel data. OpenStreetmap uses it for the outlines of continents and for borders and administrative boundaries, which are obtained from extraneous sources. Shape files can also be generated with the GDAL library and utilities to obtain contour lines from raster elevation data.
The only obligatory child tag has the name file and the shape file name as
its value. (Of course the type parameter is also needed, but that is not
shape file specific.) According to the
Mapnik wiki page, the
encoding of text in the shape file can be given in an optional parameter.
Mapnik also supports a csv (comma-separated value) data source type, a
plain-text format common on Windoze that is well suited for quick addition of
supplementary data. The data source allows integrating data into the style
file by using the inline parameter. See here for
more information and several examples. The CSV data source is documented on
this wiki page.
Other supported data source types
All data source types require an input plugin. In order to find out which data sources your Mapnik build supports, you can simply look at its input plugin directory, which is /usr/lib/mapnik/input on my system. The path of that directory can be obtained via mapnik-config, so you can list all input plugins as follows:
ls `mapnik-config --input-plugins`
There seems to be no documentation page giving an overview of all (potentially)
available data sources. My installation provides the following:
CSV,
GDAL,
GeoJSON,
OGR,
PgRaster,
PostGIS,
Raster,
Shape,
SQLite,
and TopoJSON (apparently a variant of
GeoJSON; undocumented).
Inheritance of data source parameters
The Datasource tag supports a kind of inheritance. It works with two tag attributes (not parameter child tags), name and base. A base attribute with a value equal to the value of the name attribute of a different Datasource tag causes its parameter child tags to be inherited. This is quite useful for setting most of the parameters of a PostGIS database source in a Datasource tag at the top level and later referring to it and specifying the table parameter. The standard OpenStreetmap style uses XML entities for that purpose, even though Mapnik's current default build does not support them.
Symbolizers are child tags of Rule tags that control what is drawn on a map. The graphical object they specify is drawn at the coordinates of the map features to which the rule applies. They are comparatively well documented.
Most symbolizer tags have no content, with the exception of those drawing text. Most have a file attribute referencing an image, usually in PNG format. If applicable, the values of colour attributes can be a word ("white" etc.) or a # followed by three or six hexadecimal digits giving the RGB value. Most symbolizers have an attribute for partial transparency/opacity.
Database content from a PostGIS data source can be inserted into attribute values or textual content by specifying the database column name in square brackets, for example [name]. The same syntax applies to attributes in shape files, such as [elev] for the elevation of a contour line if the shape file was generated appropriately.
The following is a brief and incomplete overview. The linked pages provide
details on individual symbolizers, and the Rule tag documentation on
this page contains
a full list.
Text and shield symbolizers allow to specify fonts for their text. This can be done by specifying a font name in the face-name attribute. Note that the font name is case sensitive. (Bear this in mind if Mapnik fails to find your fonts; I had to capitalise the font names in the OpenStreetmap style, either because Mapnik versions before 3 did not care or because the capitalisation of the names of the fonts themselves was changed.)
The other way to specify fonts is to declare a font set with the
FontSet tag. The font set
is referenced with the attribute fontset-name of the symbolizer, which
contains the same string as the name attribute of the FontSet tag.
Fonts from the font set are tried in order for each character, which allows to
support multiple alphabets with multiple fonts. If a font is unavailable, it
is ignored, so that later fonts automatically act as fallbacks. The
OpenStreetmap style for example uses the following font set for most of its
text:
<FontSet name="book-fonts">
  <Font face-name="DejaVu Sans Book" />
  <Font face-name="Unifont Medium" />
</FontSet>
Frequently used qualifiers for style rules are restrictions to a range of map scales using the two tags in the following example:
<MaxScaleDenominator>50000</MaxScaleDenominator>
<MinScaleDenominator>25000</MinScaleDenominator>
Clearly a pixel size has to be implicit in these restrictions, considering
reality is measured in length units while the size of a digital map is in
pixels. That pixel size is
documented as 90 pixels per
inch, or 0.28 mm per pixel.
As is also stated on the linked page, the map scale undergoes huge local variations when rendering a tiled map covering the whole world like OpenStreetmap. This is because the (Pseudo-)Mercator projection used basically projects the surface of the earth outwards from its axis of rotation onto a cylinder, which is then unrolled and serves as a planar map. This causes a variation in scale proportional to cos(latitude). Look at the following two OpenStreetmap screenshots of Gabon (on the equator) and Norway (latitude 60°) at the same zoom level:
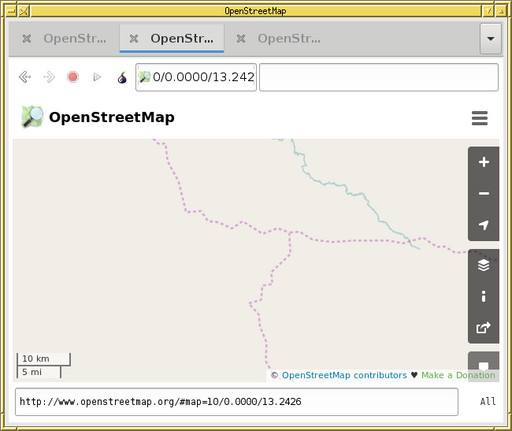
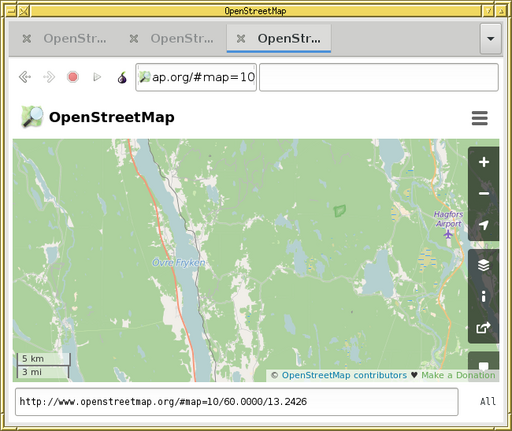
Even though zoom levels correspond to map scales, the scale indicators of 10 km and 5 km, respectively, are the same size.
This means that the real map scale for a given nominal scale (which determines the style) will vary by up to a factor of four (latitude 75° in Greenland or the Taymyr peninsula in northern Russia). This is the reason printed world maps practically never use Mercator projection, but accept angular distortion in exchange for a more consistent scale.
The scale of Mapnik's scale qualifier tags always refers to the equator.
Map projections define how to translate a point on the surface of the Earth to a flat surface, such as pixels in a map image or cartesian coordinates in the OpenStreetmap database. They can occur in two places in Mapnik style files: in the top-level Map tag, and in the Layer tags. (In the case of the Layer tag, the projection really applies to the data source the layer uses. There is no good reason for duplicating it in every layer that uses the same data source, but that is Mapnik's design for you.)
The projection is specified in the srs attribute of the tag in question. Its value is a string containing option undestood by proj (docs listed here). The projection of the layers using the OpenStreetmap database as a data source has to be the same as the one chosen when running osm2pgsql to import the OpenStreetmap data into the database. The old standard OpenStreetmap style uses other data sources defined in different projections, such as boundaries of adminstrative regions and towns.
The map projection of the Map tag determines the projection of the map that Mapnik renders. It can be chosen arbitrarily, as Mapnik transforms data from data sources as needed (using the proj library). All have their individual advantages and drawbacks. In this section, I show a comparison of three projections for Scotland and northern England. The two documentation PDF files linked in the proj documentation section desribe most projections in some detail.
XML entities are in effect
constant declarations in XML files that can be referenced later and in multiple
places. They also allow including other XML files. The
old standard
OpenStreetmap style uses them to reduce the size of the style files and
prevent duplication.
The important thing to know about Mapnik and XML entities is that Mapnik
supports them only when built to use libxml2. Since version 3,
this is not the default.
Besides I have encountered buggy development versions that did not support
entities even when built with libxml2. An apparently out-of-date
wiki page
recommending their use should probably be disregarded now.
XML files containing entities can be converted to single-file XMLs without
entities using the xmllint program that comes with
libxml2, for example converting the OpenStreetmap
style:
xmllint --noent osm.xml > osm-noent.xml
For data source parameters, the inheritance feature of the Datasource tag is a convenient replacement.
Licensed under the Creative Commons Attribution-Share Alike 3.0 Germany License 